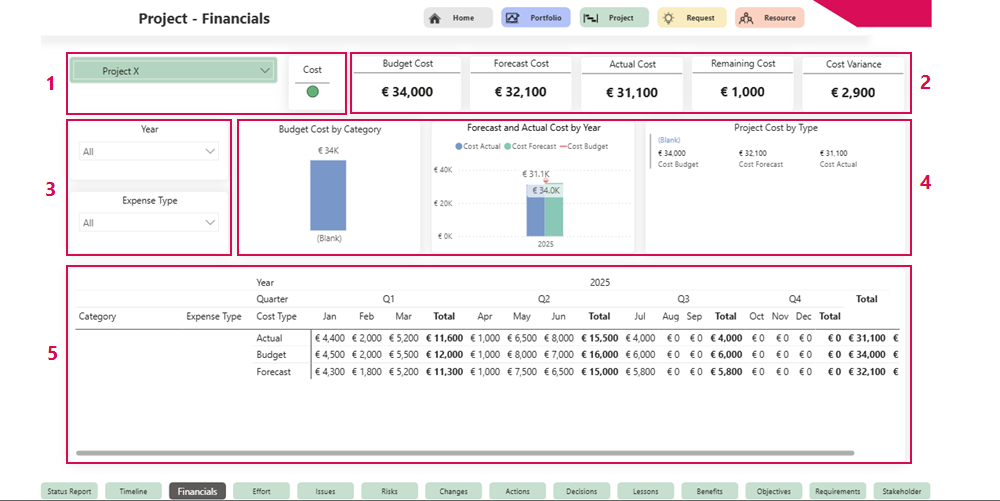
Financials
The Financials tab provides a detailed overview of the project's financial key figures:
▪Project name and traffic light display for evaluating the current cost situation (1)
▪Numerical information on costs (2):
▪Budget Cost
▪Forecast Costs
▪Actual Cost
▪Remaining Cost
▪Cost Variance
▪Filter and customize data using two drop-down menus (3):
▪Select the year for which you want to view financial data.
▪Select the cost type.
▪Bar charts show cost development and project costs by type (4)
▪Annual overview of costs in table form (5):
▪Actual
▪Budget
▪Forecast
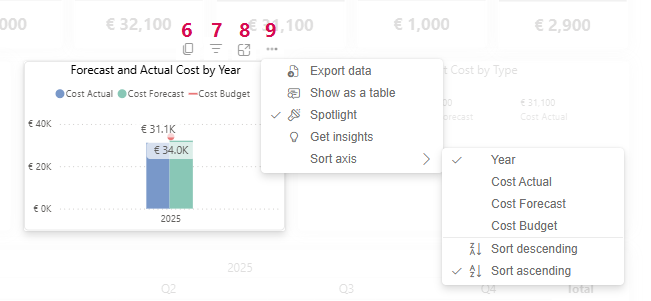
Additional display options for the bar chart:
The bar chart compares actual costs with projected costs. The following options are available:
▪Copy bar chart as graphic (6)
▪Apply filters to influence the visual display (7)
▪Display enlarged bar chart (8)
▪More options (9):
▪Export data
▪Display data as a table
▪Highlight bar chart
▪Display insights
▪Sort axes