Timeline
On the Timeline tab, you will find a visual representation of the project progress in the form of a table and a Gantt chart:
Table:
▪Rows: Task of a project
▪Columns: Start, end, days, and progress of the task
Gantt chart:
▪The duration and timeline of a process are represented by colored bars.
▪Hovering over a bar displays details about the respective process.
▪You can zoom in or out on the display:
➢Move the mouse pointer over the Gantt chart.
➢Use the mouse wheel to zoom in or out to adjust the view.
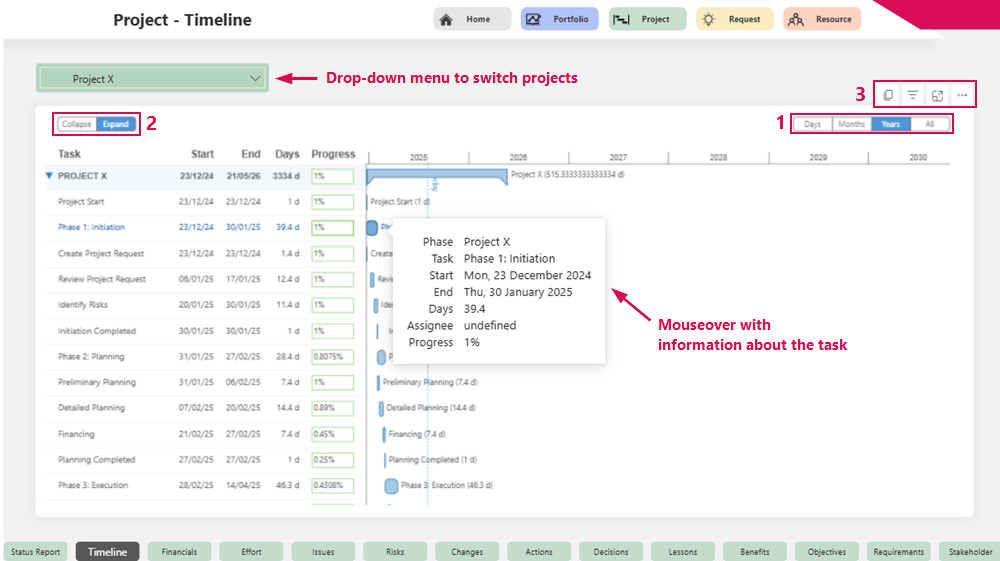
Adjusting the time scale of the Gantt chart (1):
The time scale of the timeline can be adjusted flexibly:
➢Click on the desired time scale.
▪Years (default view)
▪Months
▪Days
▪All: Automatically displays only the period relevant to the project (project start to project end).
Expand and collapse tasks (2):
➢Click Collapse. ▶ All tasks are collapsed.
➢Click Expand. ▶ All tasks are expanded.
Additional options (3):
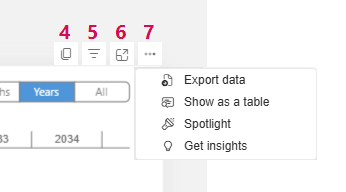
▪Copy timeline as graphic. (4)
▪Apply filters to influence the visual representation. (5)
▪Show only enlarged timeline. (6)
▪More options (7):
▪Export data
▪Display data as table
▪Highlight timeline
▪Show insights