Individual resource level
|
Work Interface and Views > Plan > Individual resource level |
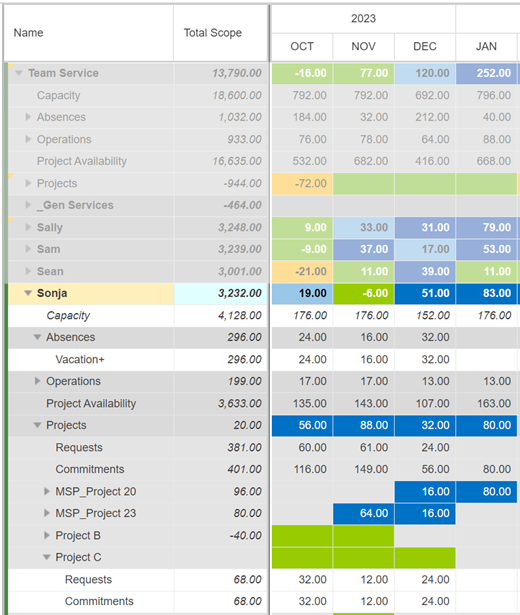
➤ The Requests and Commitments rows of individual resources are visible if Request is selected in the Show group of the menu bar:

This level shows the utilization status of the individual team resources, i.e. their remaining availability in hours. It is calculated by:
status = capacity – (absences + operations + commitments)
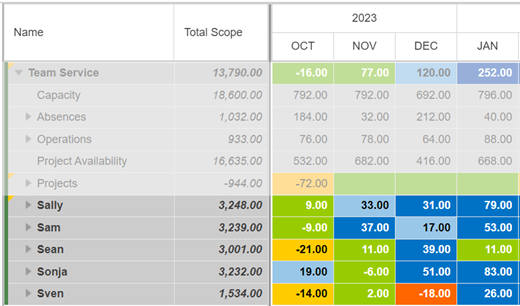
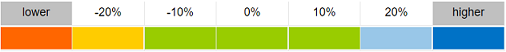
The remaining availability is shown in heatmap colors according to preset thresholds. A green field without any number indicates that the remaining availability is zero and there is no overload. A yellow field indicates that the resource is overloaded with 10% or more of their capacity, a red field shows an overload of 20% or more.
For example, Sonja’s status in November is marked green. She is overloaded with 6 hours in that month, but since this is below the threshold of 10%, the status is green. In October, December and January, Sonja’s status is marked blue because she has a remaining project availability of at least 10%.
When the resource field is expanded, you will find the respective resource data structured in the same way as at the team level. It is in the white rows at the individual resource level where you enter the planning values for each of the resources.
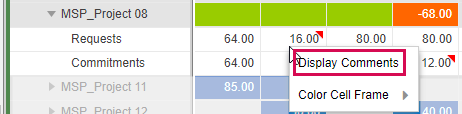
A red triangle in a Requests or Commitments row indicates that there are comments on the situation in this time phase. The comments can be accessed via right-click in the cell > Display Comments.