Histogram data
|
Work Interface and Views > Scenario > Resource table > Histogram data |
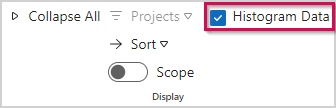
➤ Detailed histogram data are hidden by default. You can unhide or hide the rows by selecting Histogram Data in the Show group of the Resources tab.
Histogram data rows:
1) |
Capacity: Capacity of the resource in hours |
2) |
Base Load: Working hours not available for project work. It is calculated by: base load = absences + general operations + individual operations |
3) |
Demand: Total amount of project work assigned to the resource |
4) |
Difference: Remaining availability of the resource. It is calculated by: difference = capacity – (base load + demand) |
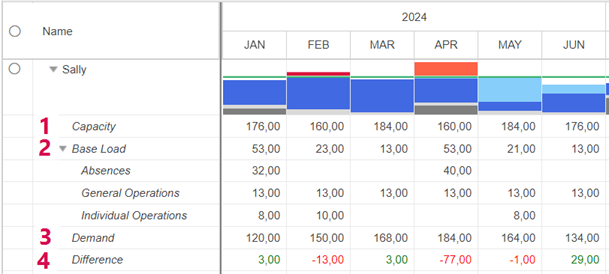
The Difference values can be displayed in the chart (see Histogram view options).