Schedule - Gantt Chart
|
Task planning in the Schedule > Schedule - Views > Schedule - Gantt Chart |
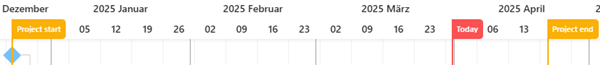
In the view on the right-hand side, the processes are displayed graphically in the form of a Gantt chart.
By default, the Project start date, Today's date and the Project end date are marked on the timeline in the Gantt chart.
▶ The project tasks are placed one below the other on the timeline. (see Scheduler - Views)
The tasks are visualized with various symbols:
Task |
Symbol |
|---|---|
Summary Task |
 |
Subtask |
 |
Milestone |
 |
The dependencies between the tasks are visualized with arrows in the Gantt chart. (see Define dependencies between Tasks)
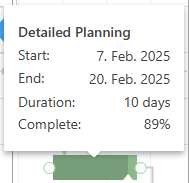
Move the mouse pointer over an operation to obtain information about it: