Difference view
|
Work Interface and Views > Scenario > Resource table > Difference view |
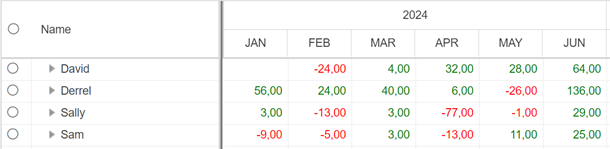
Histogram and heatmap can be replaced with numerical values showing the difference between capacity and planned work in hours. Negative Difference values are shown in red. This can be helpful to get a quick overview of the time phases and degree of overloads.
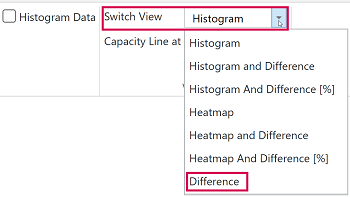
▪To activate this view, go to the View group of the Resources tab.
▪Open the drop-down menu next to Switch View and select Difference.
Green numbers indicate remaining availability.
Empty fields indicate that the difference between capacity and planned work is zero.
When the Difference view is selected, the Difference row will not be shown in the table.