Histogram view options
|
Work Interface and Views > Scenario > Resource table > Histogram view options |
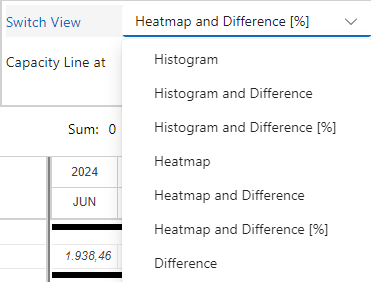
By default, the resource chart shows the histogram without numerical values. You can add the difference between capacity and planned work in hours or percent.
▪To add the numerical values, go to the View group of the Resources tab.
▪Open the drop-down menu next to Switch View and select the desired histogram view.
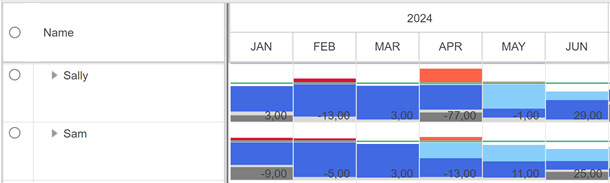
Histogram and Difference shows the histogram with numerical values in hours.
Histogram and Difference [%] shows the histogram with numerical values in percent of the capacity.
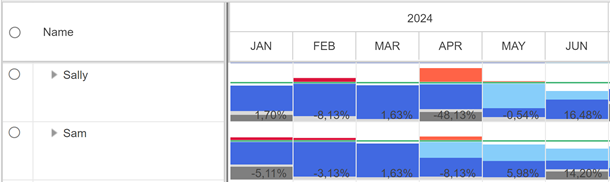
If the difference between capacity and planned work is shown in the histogram, the Difference row will not be shown in the table.