Resource table
|
Work Interface and Views > Scenario > Resource table |
The resource table lists all resources of the opened scenario. The projects to which the resources are assigned are shown as sub-items.
Entries above the first resource show the aggregated data of all scenario resources.
As soon as the cursor is placed in the resource table, the Resources tab is opened.

A colored histogram is shown only for resources whose capacity is greater than zero. Generic resources have a default capacity of zero, so the chart space under the timeline is gray.
Columns:
1) |
Project State: Value Running or New according to the setting in the project table. In the resource table, this field is read-only. |
2) |
Comments: Comments can be entered in the rows of the resource names. General scenario comments can be accessed via right-click in the scenario row > Display Comments. |
3) |
Start/Finish: Start and finish date of the assigned work |
4) |
Total: Amount of project work assigned to the resource in total (resource row) or for the project (project row) |
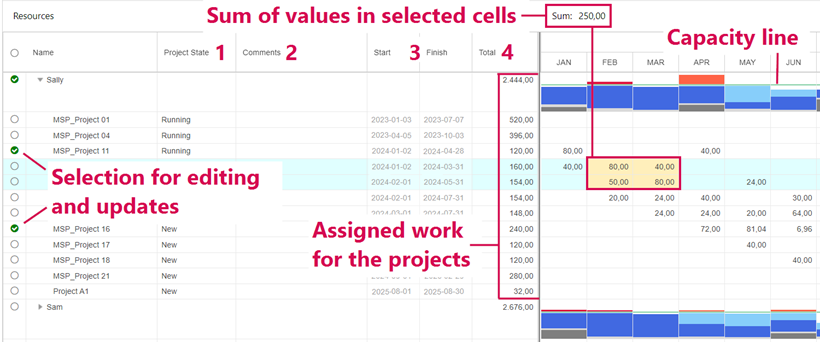
Dark blue: Regular work for running projects
Light blue: Regular work for new projects
Red: Overload caused by work for running projects
Orange: Overload caused by work for new projects
Dark gray: Absences
Light gray: Line operations
A tooltip in each time phase shows these data and the capacity in hours:
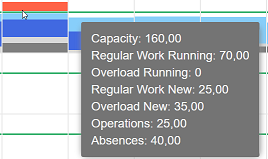
To display more detailed data in the table, see Histogram data.
The histogram can be switched to a heatmap.