Scenario
Scenario is the main view for analysing and running through various options. You can open one scenario at a time. When a scenario is opened (see Checking in and out), this view opens by default.
A scenario shows the projects and resources of a portfolio in a combined table:
The project table shows the data grouped by projects.
The resource table shows the data grouped by resources.
Under the timeline on the right, the default setting shows the project duration as a bar chart and the resource utilization as a histogram. Project state and categories of work data are differentiated by color.
The fields in the left part of the table can be edited except the date fields, Name, Modified by and Total.
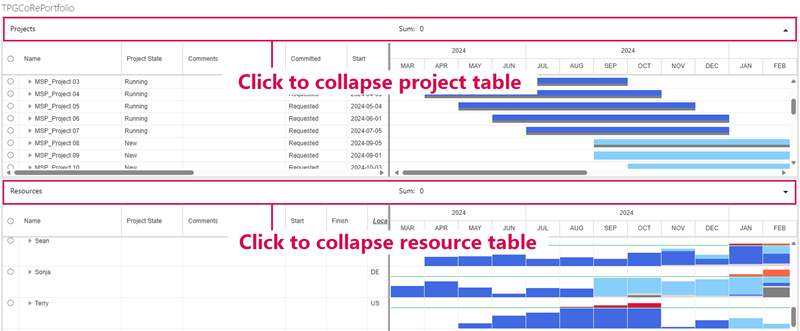
Both tables can be collapsed or expanded by clicking in the area above the table.
Sub-items show the assigned work as numeric values under the timeline.
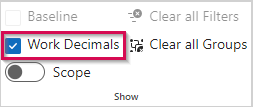
▪If you want to see the values without decimals, deselect Work Decimals in the Show group of the menu bar.
Non-integer values will be displayed as rounded.
Work data can be entered both in the project table and the resource table.