Adv Grid with Infini-Scroll, Multi-Year View & Upgrade Process
Overview
The Multi-Year View brings horizontal infinite scroll to PPP Advanced Grid, enabling planners to see, edit, and chart resource and financial data across multiple years without changing views. The experience ships with a new year-pivot data model, modernized navigation, and synchronized charting so that Resource Plan and Financial grids stay aligned with the active period range.
Key Benefits
▪Scroll or jump across years without switching tabs or views.
▪Primary/non-primary rows keep totals accurate while allowing granular monthly edits.
▪Previous/Next buttons, drop-down pivot, and collapsible groups make it easy to focus on the relevant years.
▪Visuals now follow the same slice of time as the grid, helping stakeholders understand trends at a glance.
Feature Details
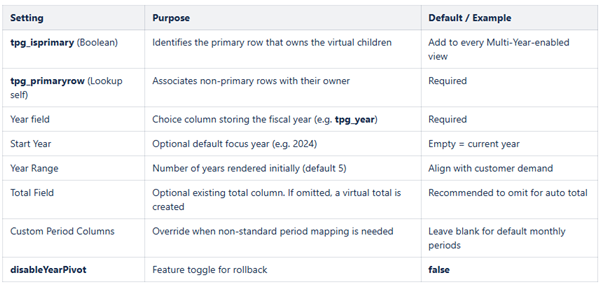
1. Year Pivot data model
▪New config flag disableYearPivot (default false). Set to true to fall back to legacy monthly columns if required.
▪Grid rows now include primary/non-primary relationships so delete, copy, and manual entry keep virtual child rows synchronized.
▪Internal CRUD pipelines fan out changes to every hidden period row tied to the same resource/task combination, ensuring Year Totals stay accurate.
2. Infinite horizontal scroll & navigation
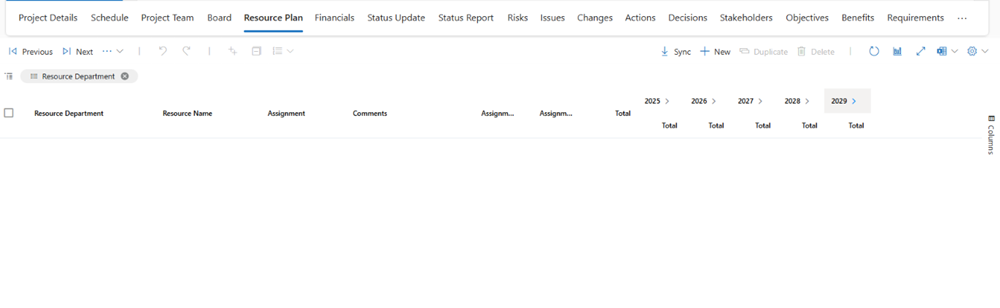
▪Period columns render inside per-year groups with the Year Total column pinned first so collapsed years still show aggregate numbers.
▪Year groups are generated from project start/end plus any persisted periods outside that window, so historical and future data remains visible.
▪Navigation updates:
▪Previous/Next buttons replace single-year filters and scroll the grid to centre the selected year.
▪Drop-down ("...") that lists every year and jumps focus directly to that group.
▪Collapsing a year hides its period columns while keeping totals; expanding restores months immediately.
▪Copy/paste helpers work across virtual columns so workloads can be duplicated from one year to the next without re-entry.
3. Chart synchronization
▪Chart aggregation mirrors the visible virtual columns and trims to the same period span.
▪Navigation actions (Previous/Next, drop-down) trigger chart refresh so visuals always match the grid slice.
4. Post-upgrade data migration
▪The plugin scans existing Resource Plan and Financial rows, flags the first row in each matching set as tpg_isprimary, and links siblings via tpg_primaryrow.
▪Matching logic compares non-period fields (resource, department, assignment, comments, type, category, etc.) so historical data automatically gains the structure required by the new year-pivot model.
Configuration Guide
User Experience Examples
Navigate and collapse year groups
➢Open Resource Plan and select a project.
➢Use Previous / Next to move between years; the grid auto-centres the targeted group.
➢Collapse historical years to focus on the active horizon while keeping Year Totals visible.
Copy workloads across years
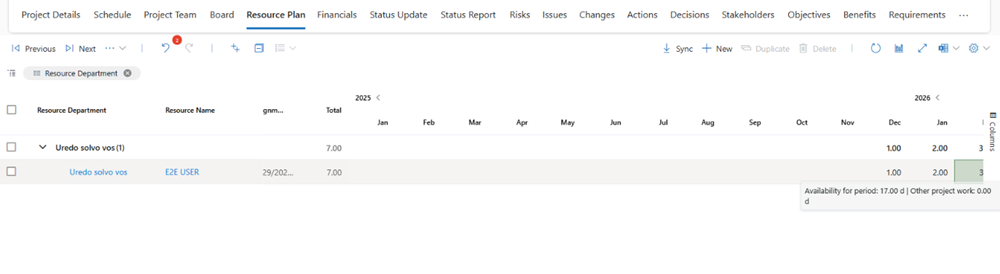
➢Expand the origin and destination years.
➢Select the starting period cell (e.g. Dec 2025) and paste values (Ctrl+V) into the next year’s Jan/Feb periods.
➢Totals update instantly; deleting the pasted values clears both period and totals while leaving the structure intact.
Chart follows the focused window
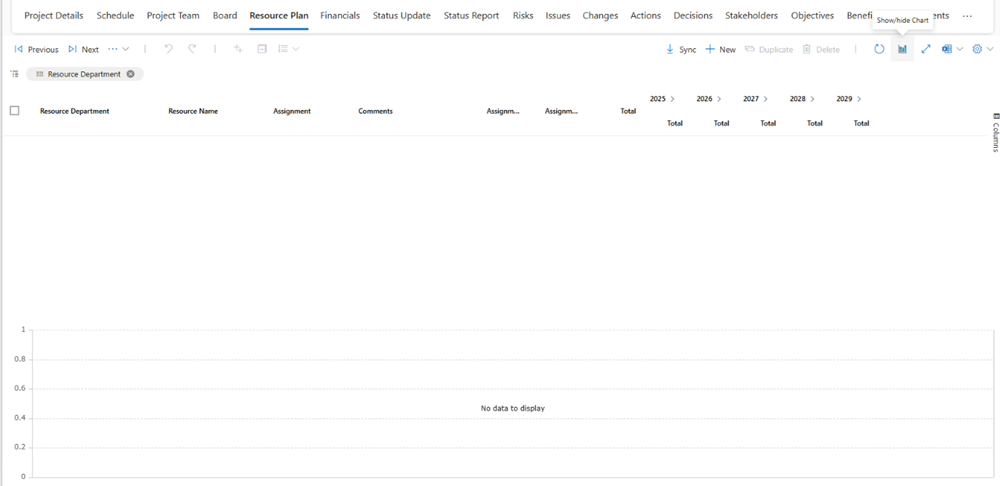
➢Click Show Chart.
➢Scroll horizontally or press Next to expose future periods.
➢The chart trims to the same period span ensuring planners compare like-for-like data slices.
Troubleshooting & Rollback
▪Toggle disableYearPivot=true in Advanced Grid config to revert to the legacy monthly view if customers report blockers.
▪Before re-enabling, confirm Power Automate upgrade flows (000.2 / 000.3) have populated tpg_isprimary and tpg_primaryrow for all legacy rows.